setwd("my/dir")
raw<-read.table("raw_reads.stats.txt", header=T)
preads<-read.table("preads.stats.txt",header=T)
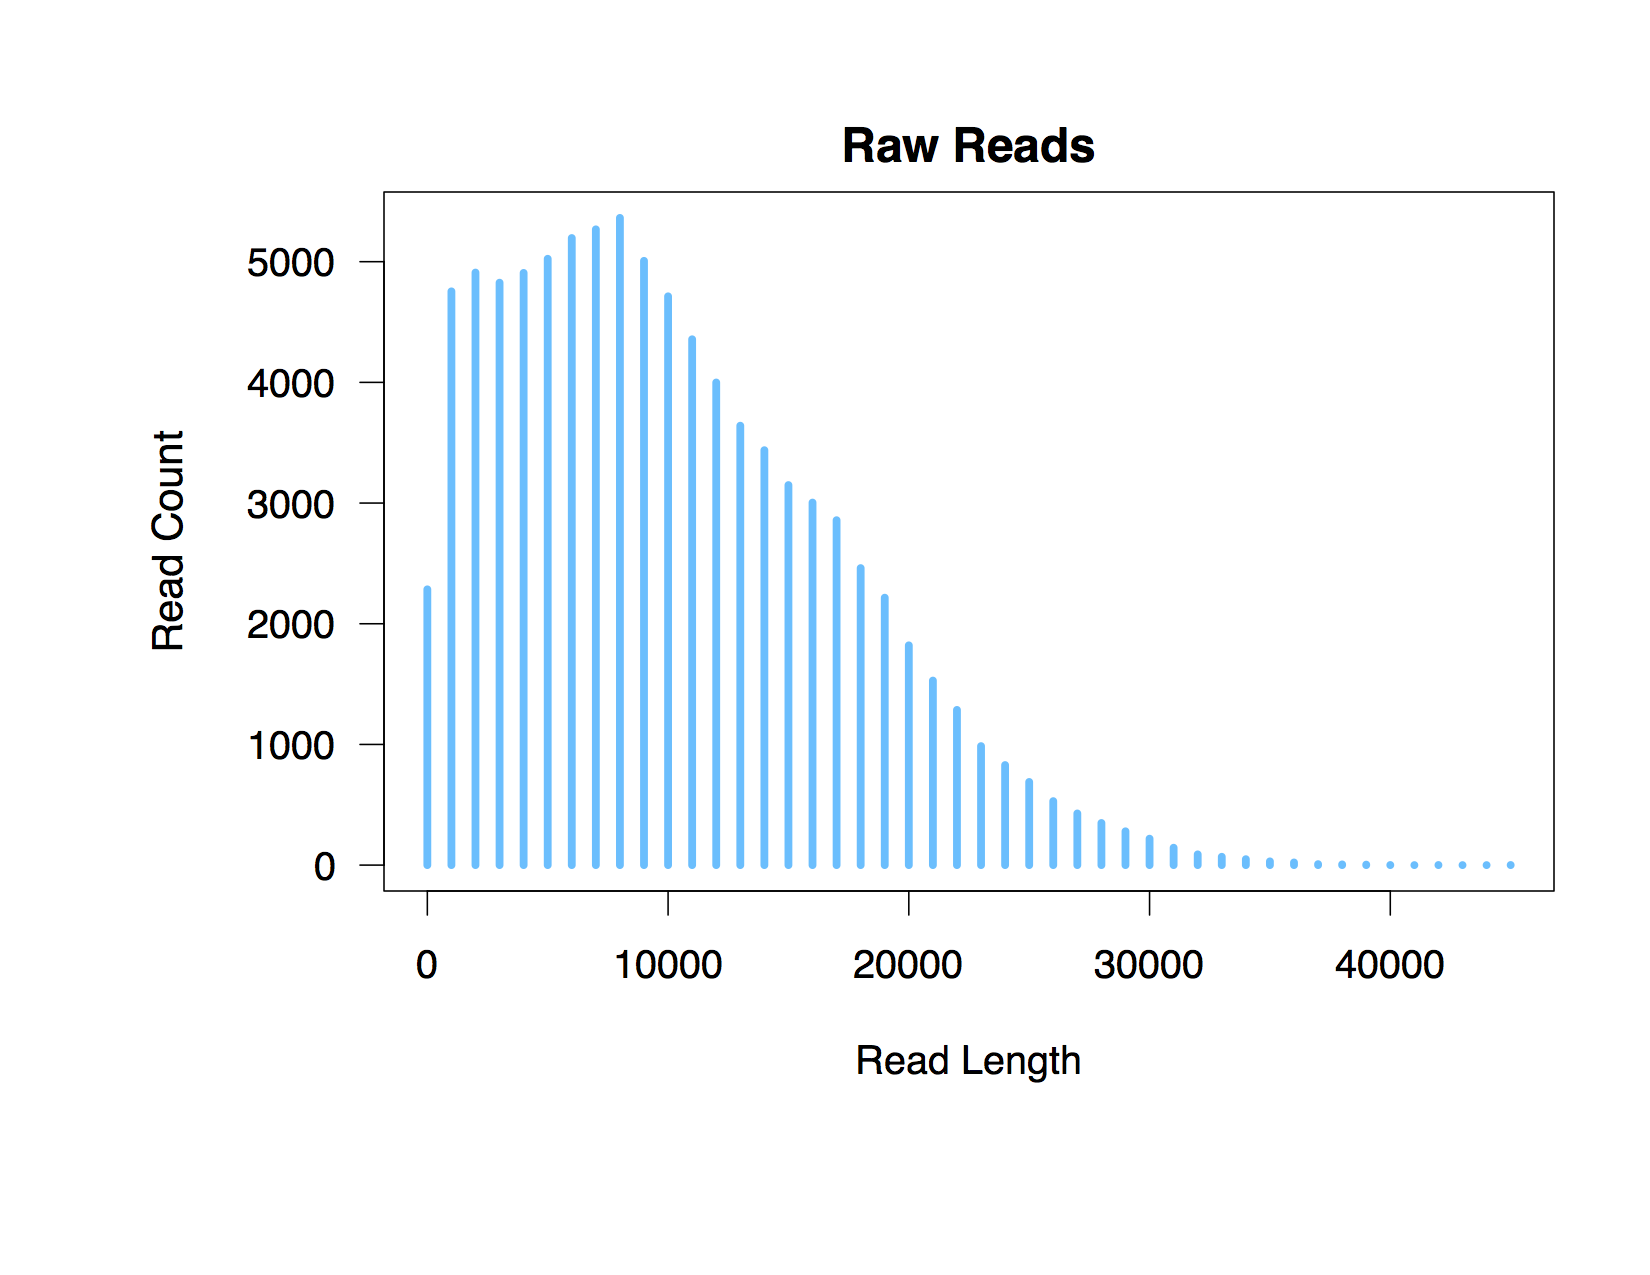
pdf(file="RawReadHist.pdf", width=11, height=8.5)
par(oma=c(4,4,2,0), cex=1.6, las=1, mar=c(4,4,2,2))
plot(data=raw, Count~Bin, type="h",col="DeepSkyBlue", lwd=5,
ylab="", xlab="Read Length", main="Raw Reads")
mtext("Read Count", side=2, cex=1.7, las=3, line=4)
dev.off()
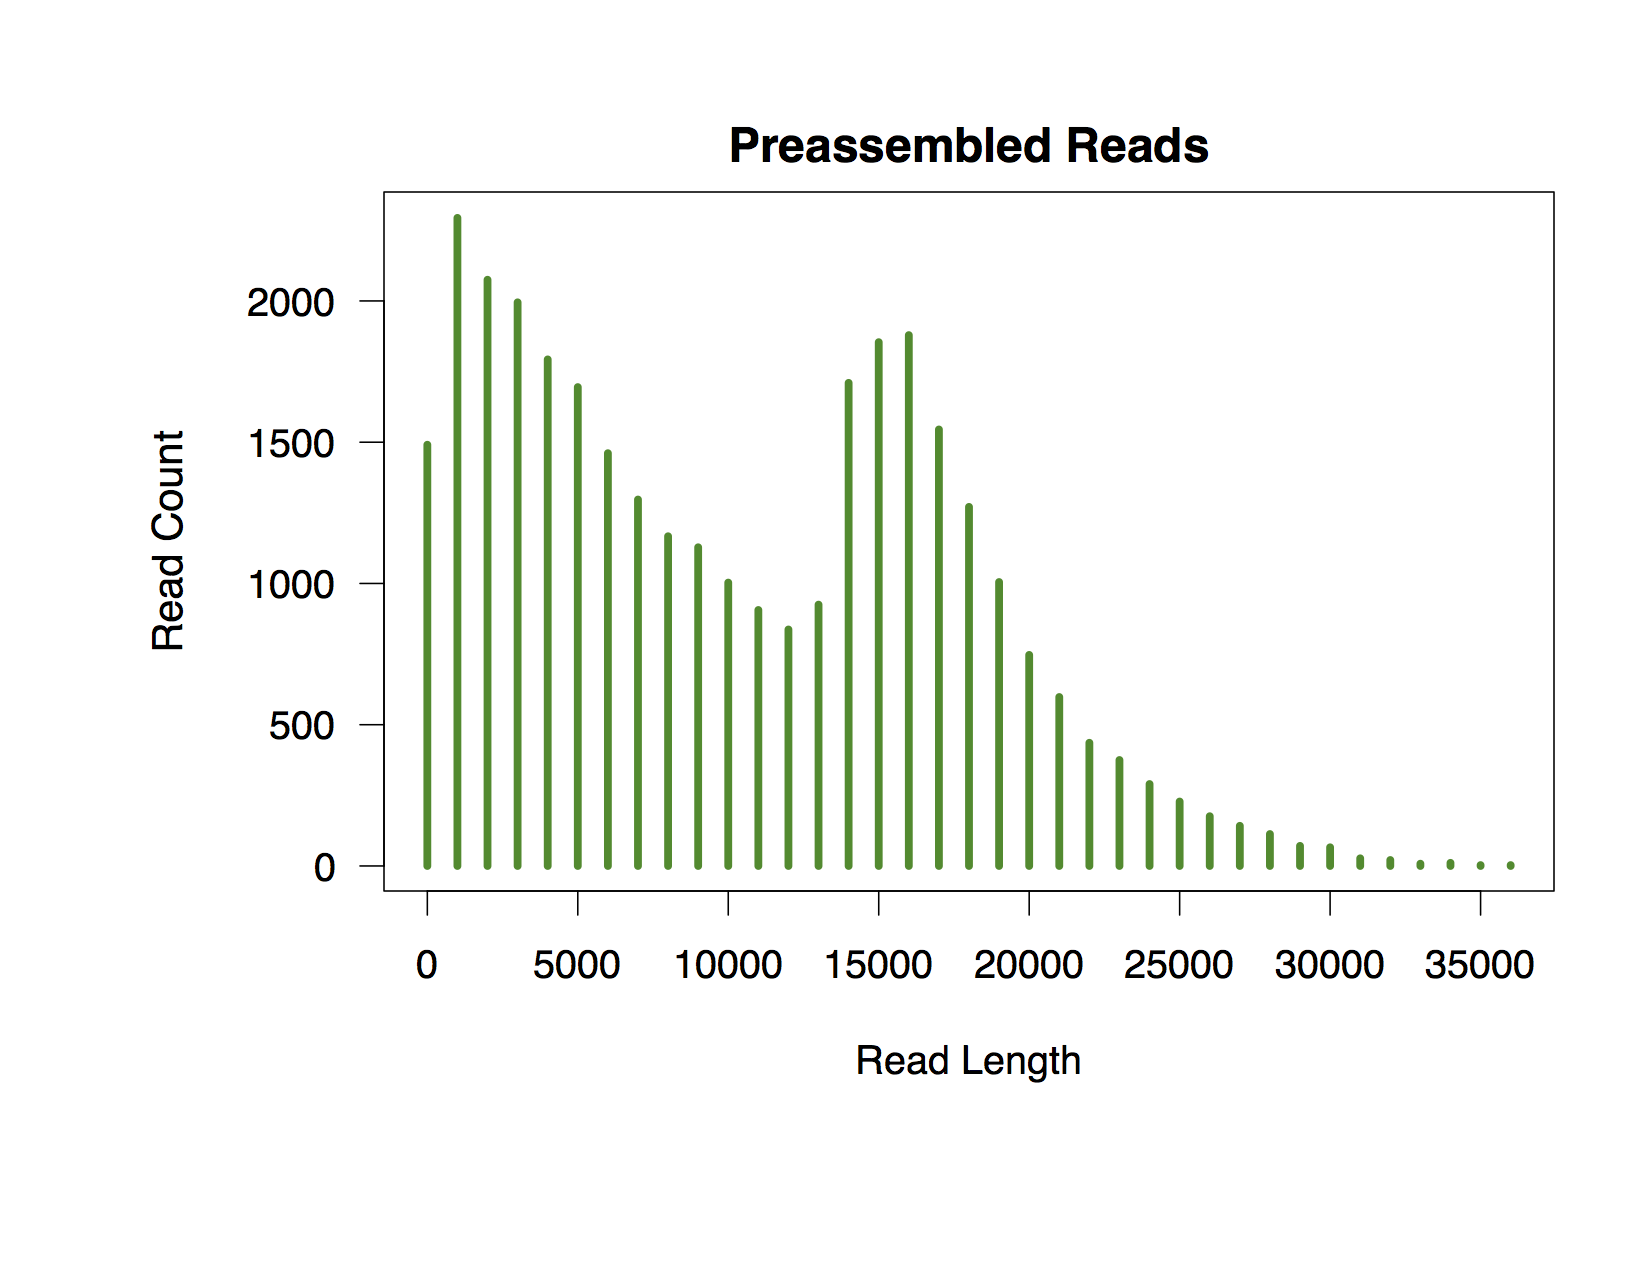
pdf(file="PreadHist.pdf", width=11, height=8.5)
par(oma=c(4,4,2,0), cex=1.6, las=1, mar=c(4,4,2,2))
plot(data=preads, Count~Bin, type="h",col="ForestGreen", lwd=5,
ylab="", xlab="Read Length", main="Preassembled Reads")
mtext("Read Count", side=2, cex=1.7, las=3, line=4)
dev.off()